CASE STUDY
Collaboration Science: Scaling Community Engagement for National Systems Change
Scaling community-centered research methods for complex stakeholder engagements
Area
Service & Product development
Role
Information Designer
Client
Employer
Engineers Canada
Duration
Coeuraj
2022-2023

Impact
18 strategic recommendations for Canadian engineering accreditation
Strengthened relationships and deeper empathy among stakeholder groups
Strategic learnings to create a digital product offering to assist in scaling our methodology
Challenge
How might we apply and scale our community-centred research methods to engage hundreds of stakeholders across Canada’s engineering ecosystem to make visible the invisible dynamics of the current national accreditation system?
Context
Following our team’s success in the St.Paul’s hospital project in combining psycholinguistics with systems thinking frameworks to deliver language based design interventions, our team was challenged with creating a repeatable methodology. We began to call our work collaboration science. We wanted to use what we had learned and see if we could create new ways of engaging with complex stakeholder engagement from our new lens.
Engineers Canada was looking to modernize their system. They put out an RFP that was exactly what we were looking for in terms of scale and applicability of our new methodology. Their system was composed of engineers both students and professionals, universities, employers and provincial accreditation hubs.
Working on the research team as a information design/systems mapping specialist, I co-led the research phase with the practice teams researcher and my data humanist teammate. I worked on primary and secondary research, building tools for workshops and system maps. Our work engaged over 200 stakeholders from the system to engage productively in revealing their mental models and talking openly about what was the true state of the system.
Project Phases
Phase 1 - Building our collaboration science offering
(1 month)
Phase 2 - Implementing a collaboration science journey
(6 months)
Phase 3 - Learning from our efforts
(1 month)
Building our collaboration science offering
In preparation for this attempt at collaboration science as a service offering, we built out key documents and processes that we were going to deploy for this work. We started to work on our framework, our own version of a theory of change based on understanding and using language as the way to reveal invisible mental models that were perpetuating negative system loops. Our initial framing was as follows:
On the lines: What people explicitly say
Between the lines: How they express themselves (emotions, values, drives)
Below the lines: Deeper mental models and worldviews
A simple metaphor to help us delineate the different strategies and tool sets we were going to deploy at various levels of the system.
Insight
In using a simple metaphor, we were better able to explain our work with our internal practice team and external clients allowing a clear understanding of our process.
Implementing a collaboration science journey
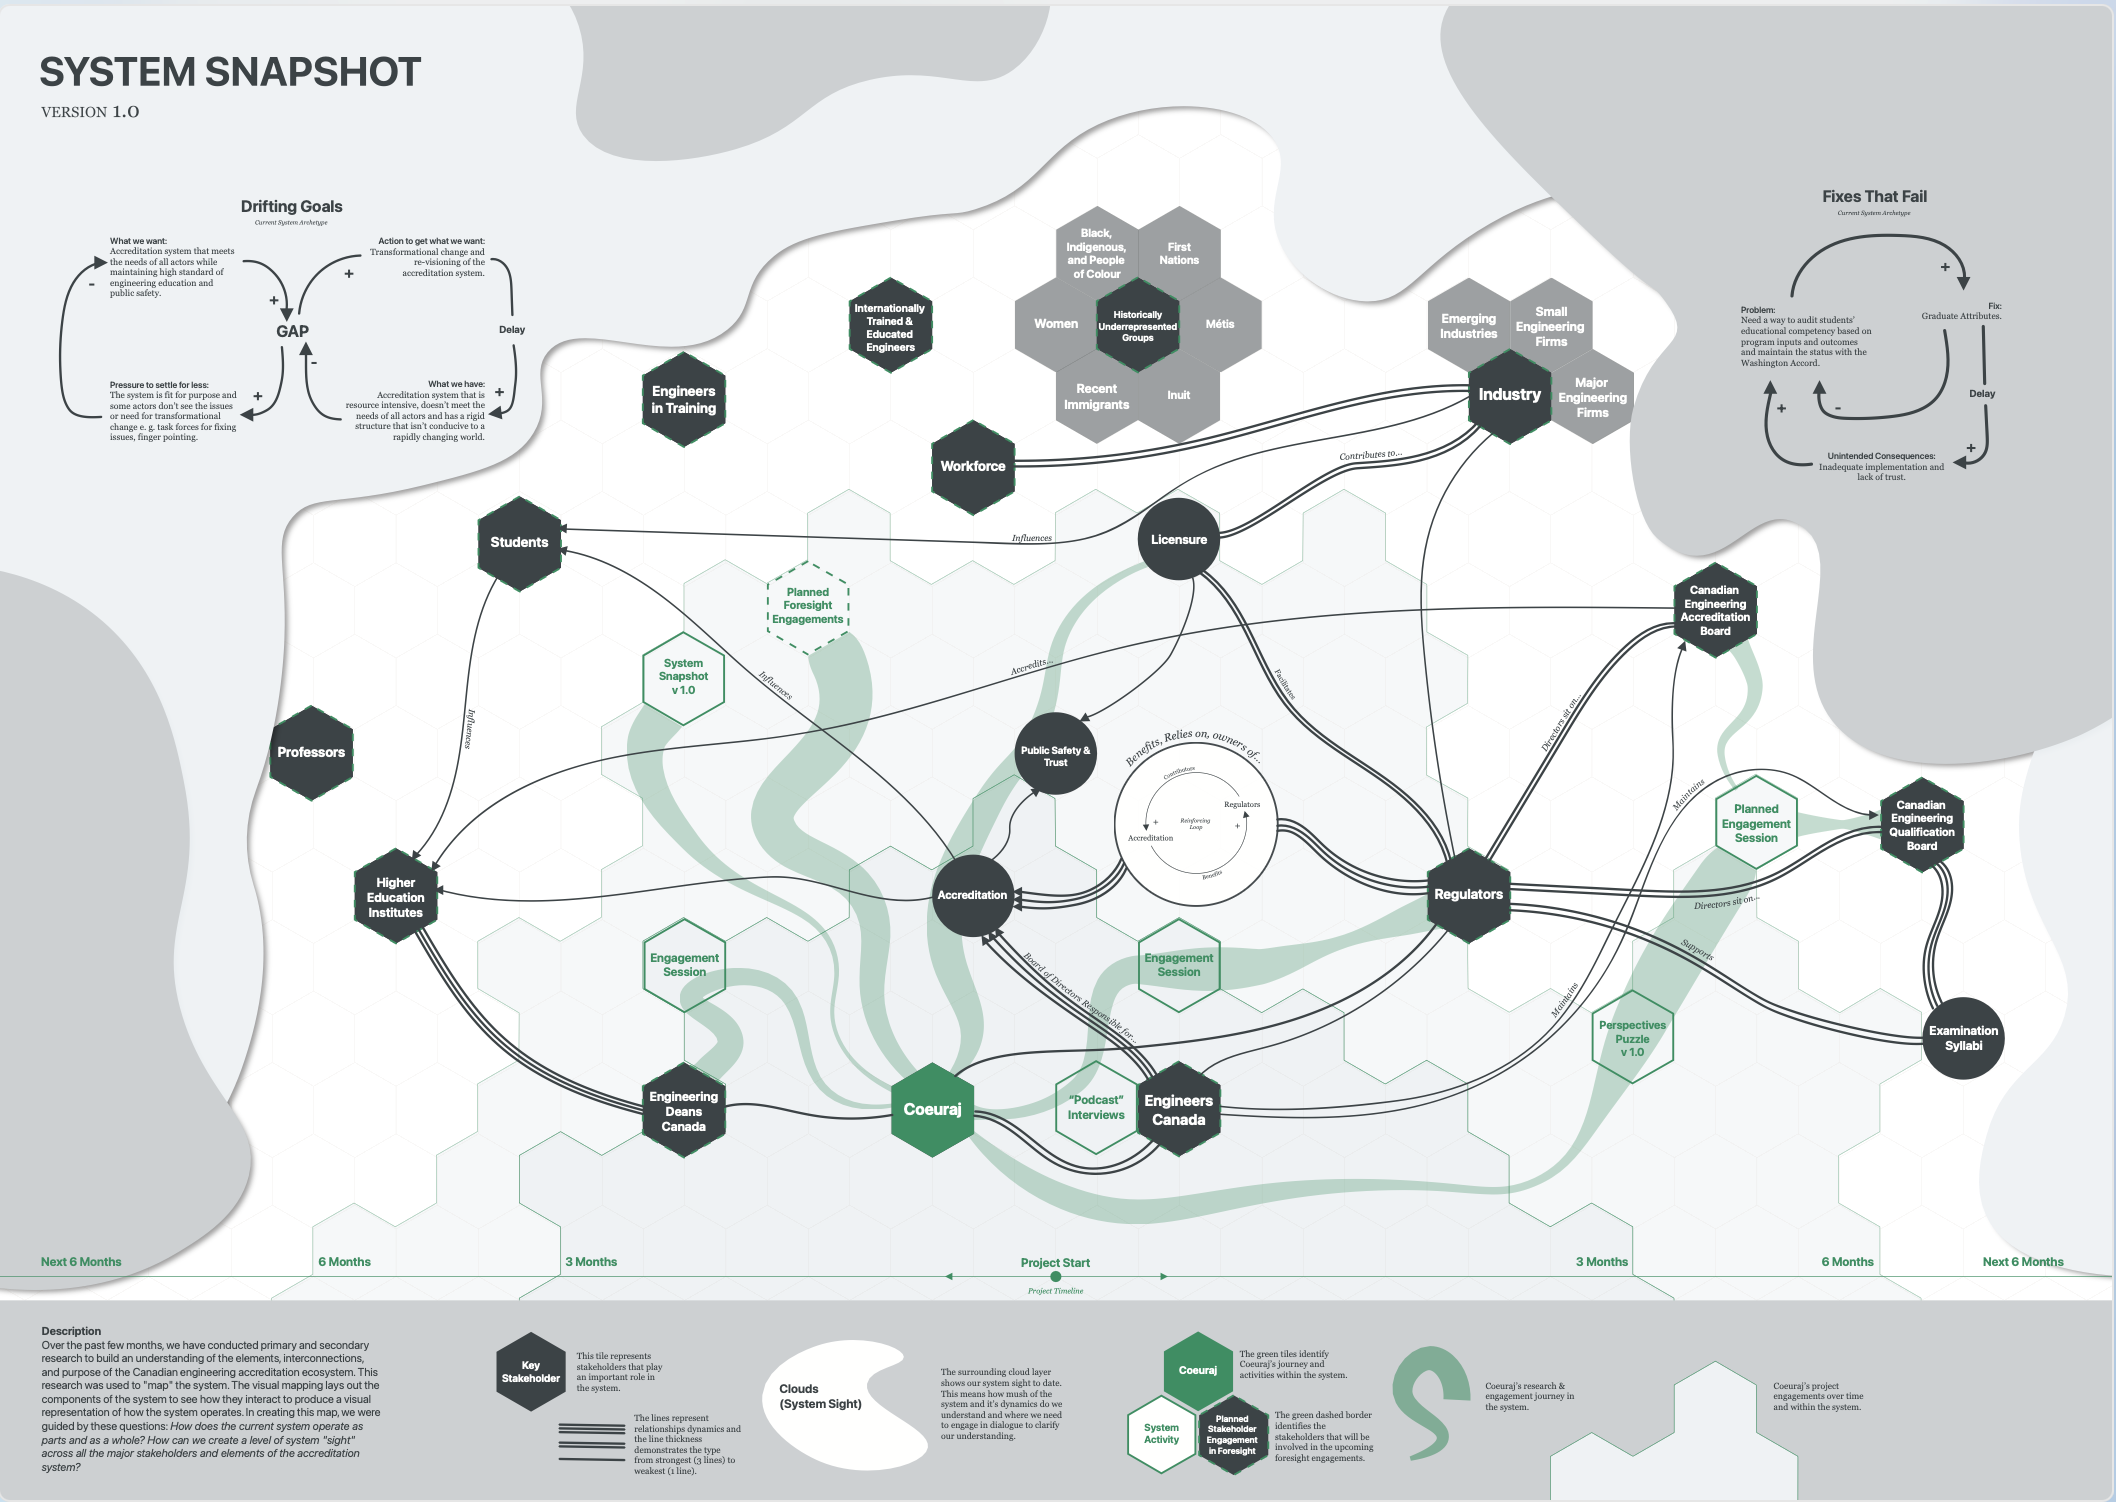
For the first 6 months of the project, my team and I worked to implement our new service into the practice team’s design process. The system itself was massive, multiple provincial boards tied together with universities, a governing body, and then relations with industry. From desk research as well as interviews with leaders we mapped out the system actors and made ecosystem maps. Each time we created a new map, I called them snapshots as a system is inherently dynamic and not static so this was a way to convey to the client that while this image was static we would continue to update our understanding throughout the entire process.
Hexagons are for complexity (Workshop)
As we progressed with the system snapshots, I also worked on workshops. One of those workshops was to help stakeholders understand that each one of them viewed the system differently. To do so, I developed a simple mapping based session. Part 1 of the workshop had them work through and process their understanding of the system of accreditation by filling out a worksheet and the second part was to then map what they had filled out onto a hexagonal grid. I chose to use hexagons as they are an excellent shape for working in complexity. Rather than having the four sides of a square you have the benefit of 6 different directions, allowing more possibility and tessellation.

Revealing the invisible
From our systems research artifacts and workshops we were able to help validate the client team’s assumptions, bring to their attention the many voices that they were not hearing from, and reveal a pathway forward.
Scaling psycholinguistics
Meanwhile, my co-researcher was conducting psycholinguistic analysis for the interviews and large volume of articles and information available on the web. This time, our team had grown to include a data scientist and machine learning engineers to help us build data pipelines to manage the new scale of language that we were listening to. So while I was conducting research I was also managing the needs of my data team members. This meant ensuring we were creating workshops and research probes with the practice team that would enable data that was usable by our data team.
Insight
Visualizing systems directly led to a clearer understanding of the voices who were being heard and those who weren’t. In tandem with the psycholinguistics analysis of our interviews, the research phase was instrumental in shifting the minds of the leadership team and mapping out a strategic plan for the next phases in the years to come.
Synthesis into service & product offerings
From this work we learned that we needed to have much more digital infrastructure to assist in managing the volumes of data we were looking at and that while psycholinguistics was useful, it required a deep understanding of the field in order to discover insights. Our goal as collaboration science was to democratize the tools and methods we knew so as to participate actively in the field of systems change. With these learnings we realized we could work towards that through a digital product for systems transformation journeys.
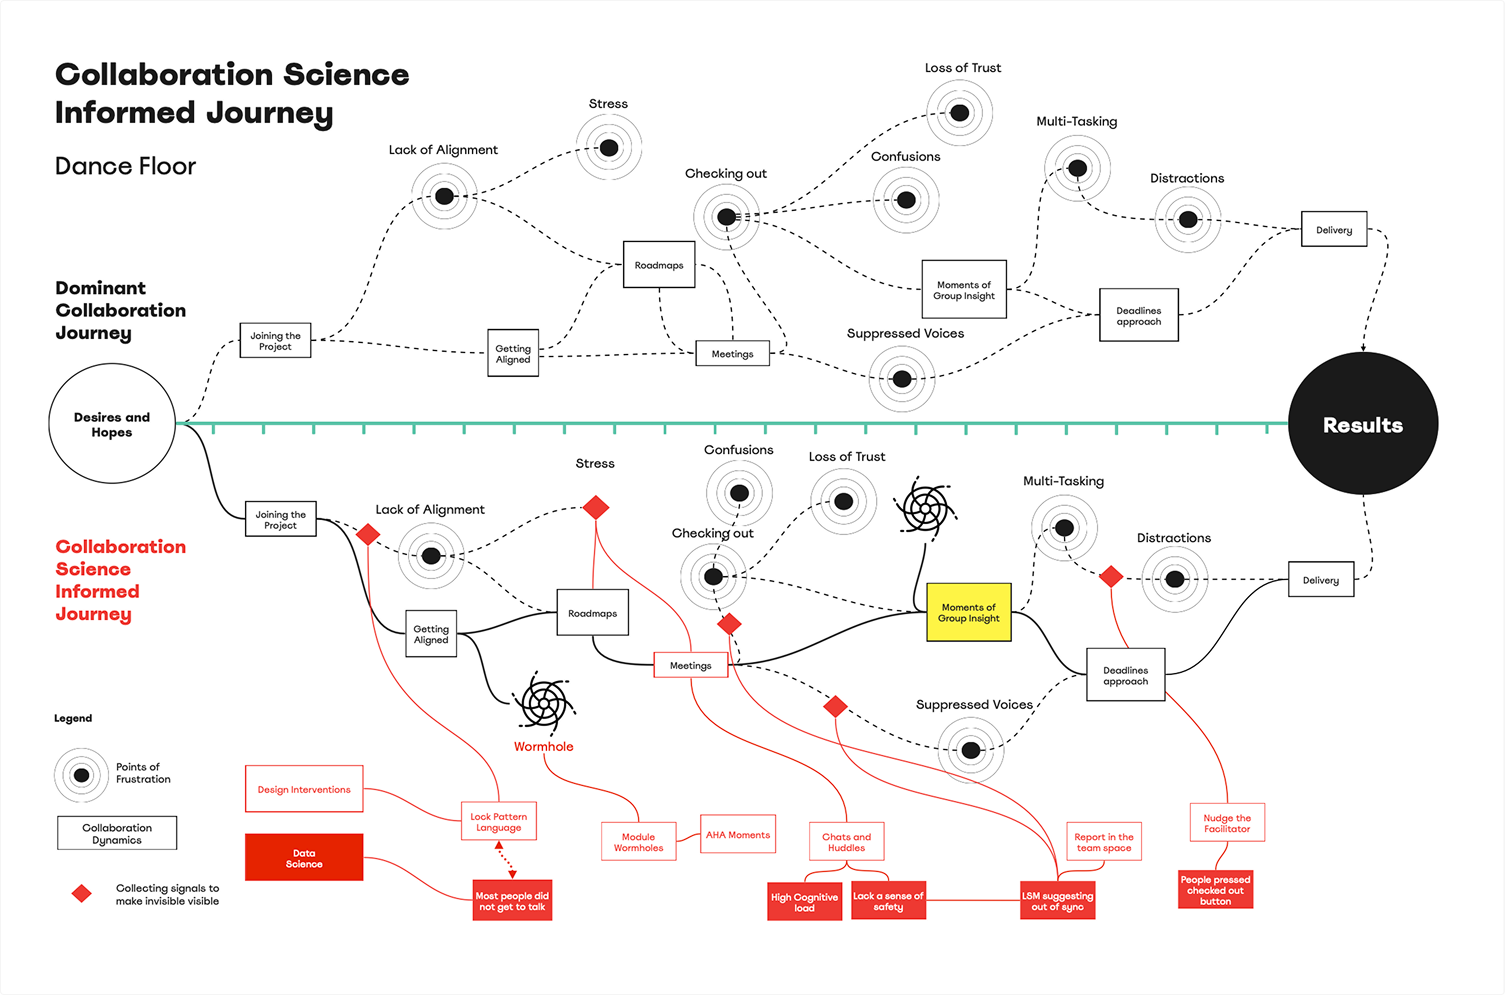
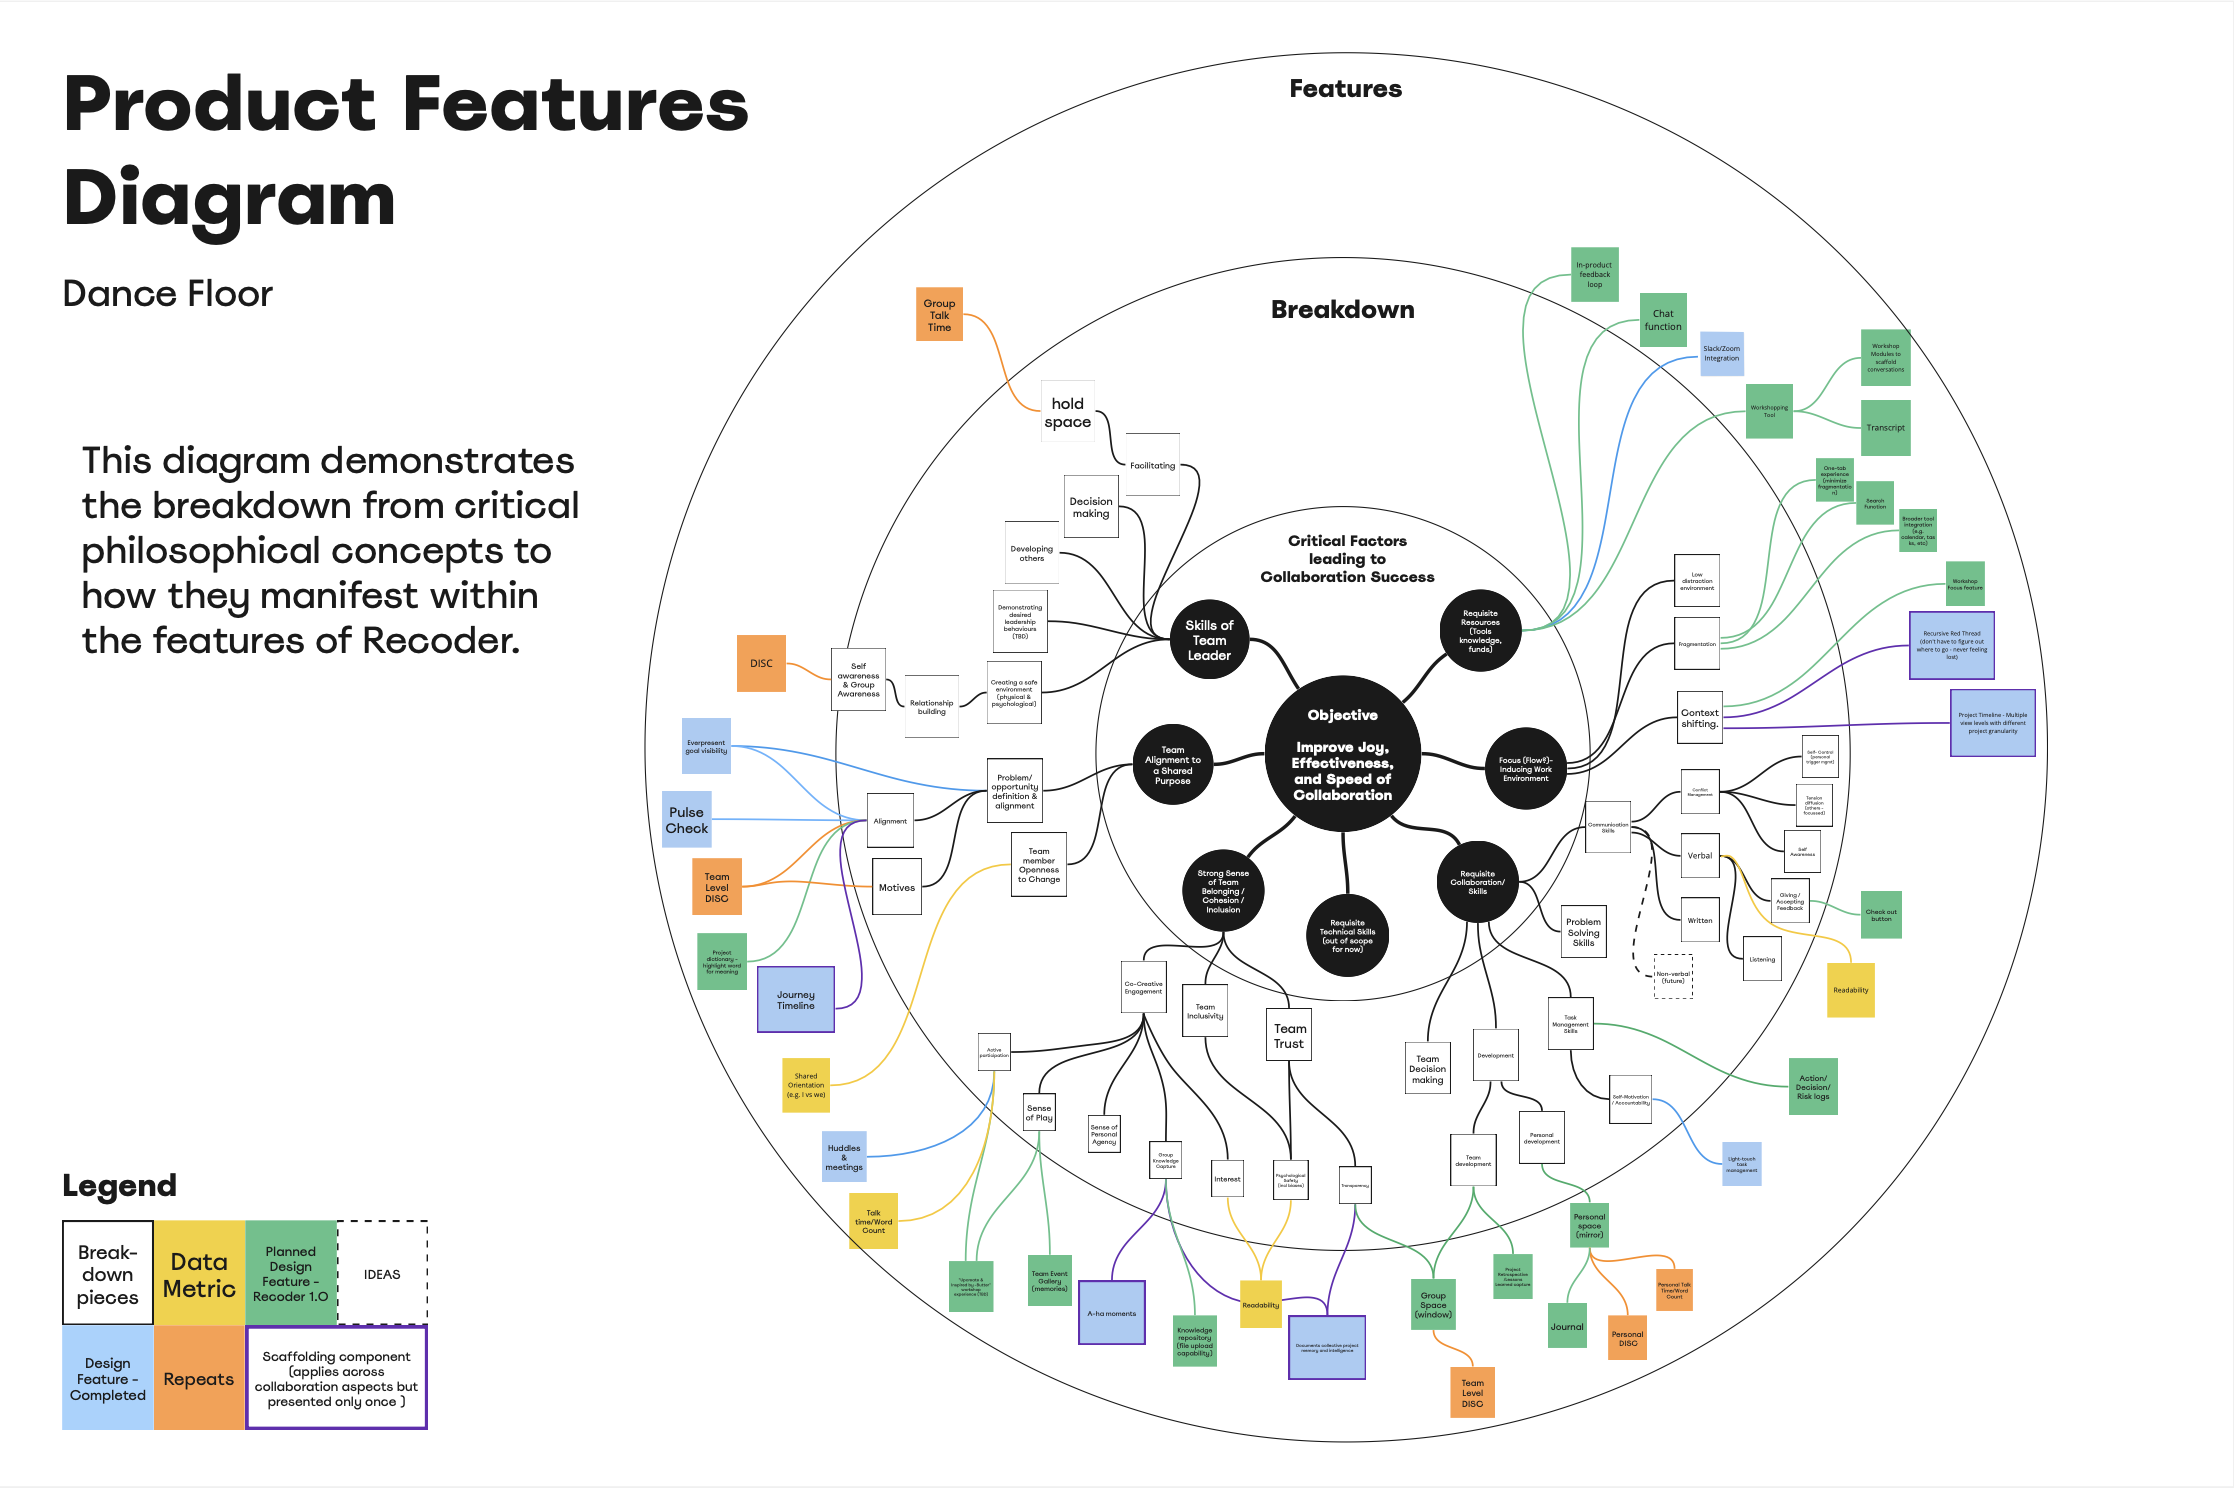
Collaboration science as a digital product
To capture our experience, I made a journey map to help clarify the service journey for our practice team. Then, with my tech and data science team, we worked to narrow down the features in a workshop where I created a product features diagram to help link key service moments with tangible product features.
Impact
For the Engineers Canada project, the impact of the foundational systems research done through a collaboration science lens led to a successful, multi-year project that is just wrapping up now (2025).
As for collaboration science, we began working on our own digital product nicknamed “Topo” which was a digital web-based app that could lead teams through a transformational journey. The work on Topo would eventually spin-off into the start-up Parafoil.
Reflection
This project reinforced the vital role that visuals play in creating a solid basis of shared understanding. From building out collaboration as a scalable service offering to creating system snapshots, every time I was able to use the craft of design to create a visual version of a conversation topic, it vastly increased understanding between stakeholders both internally and externally.
The breakthrough aha moment from this work was the moment where we realized that this could work as a service but needed to be contained in a guided journey, one that we could create digitally. This was an extremely exciting moment for me as I began to dream of community-building civic tech and all the possibilities we could foster by supporting the democratization of systems change.
The through line that I keep coming back to in this work is that the relationship is the conversation and the conversation is the relationship. A line that I read in the book Research is Ceremony by Shawn Wilson. The design of conversations became a focal point for my team's efforts in the coming year and then the foundation for Parafoil.